Mapping Anthropogenic Night Light and Noise
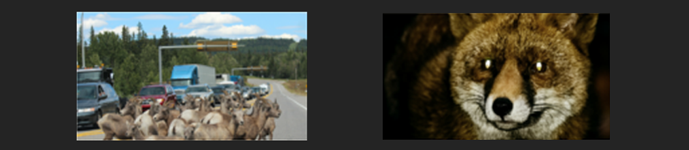
This web map shows the distribution of risk to National Parks and mammals from anthropogenic night light and noise across the contiguous US.
Follow this quick tutorial to learn how to use this application.
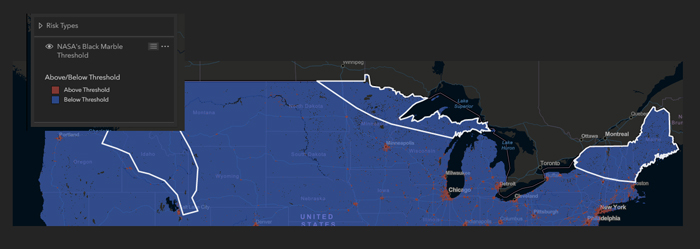
Navigating the Web Map
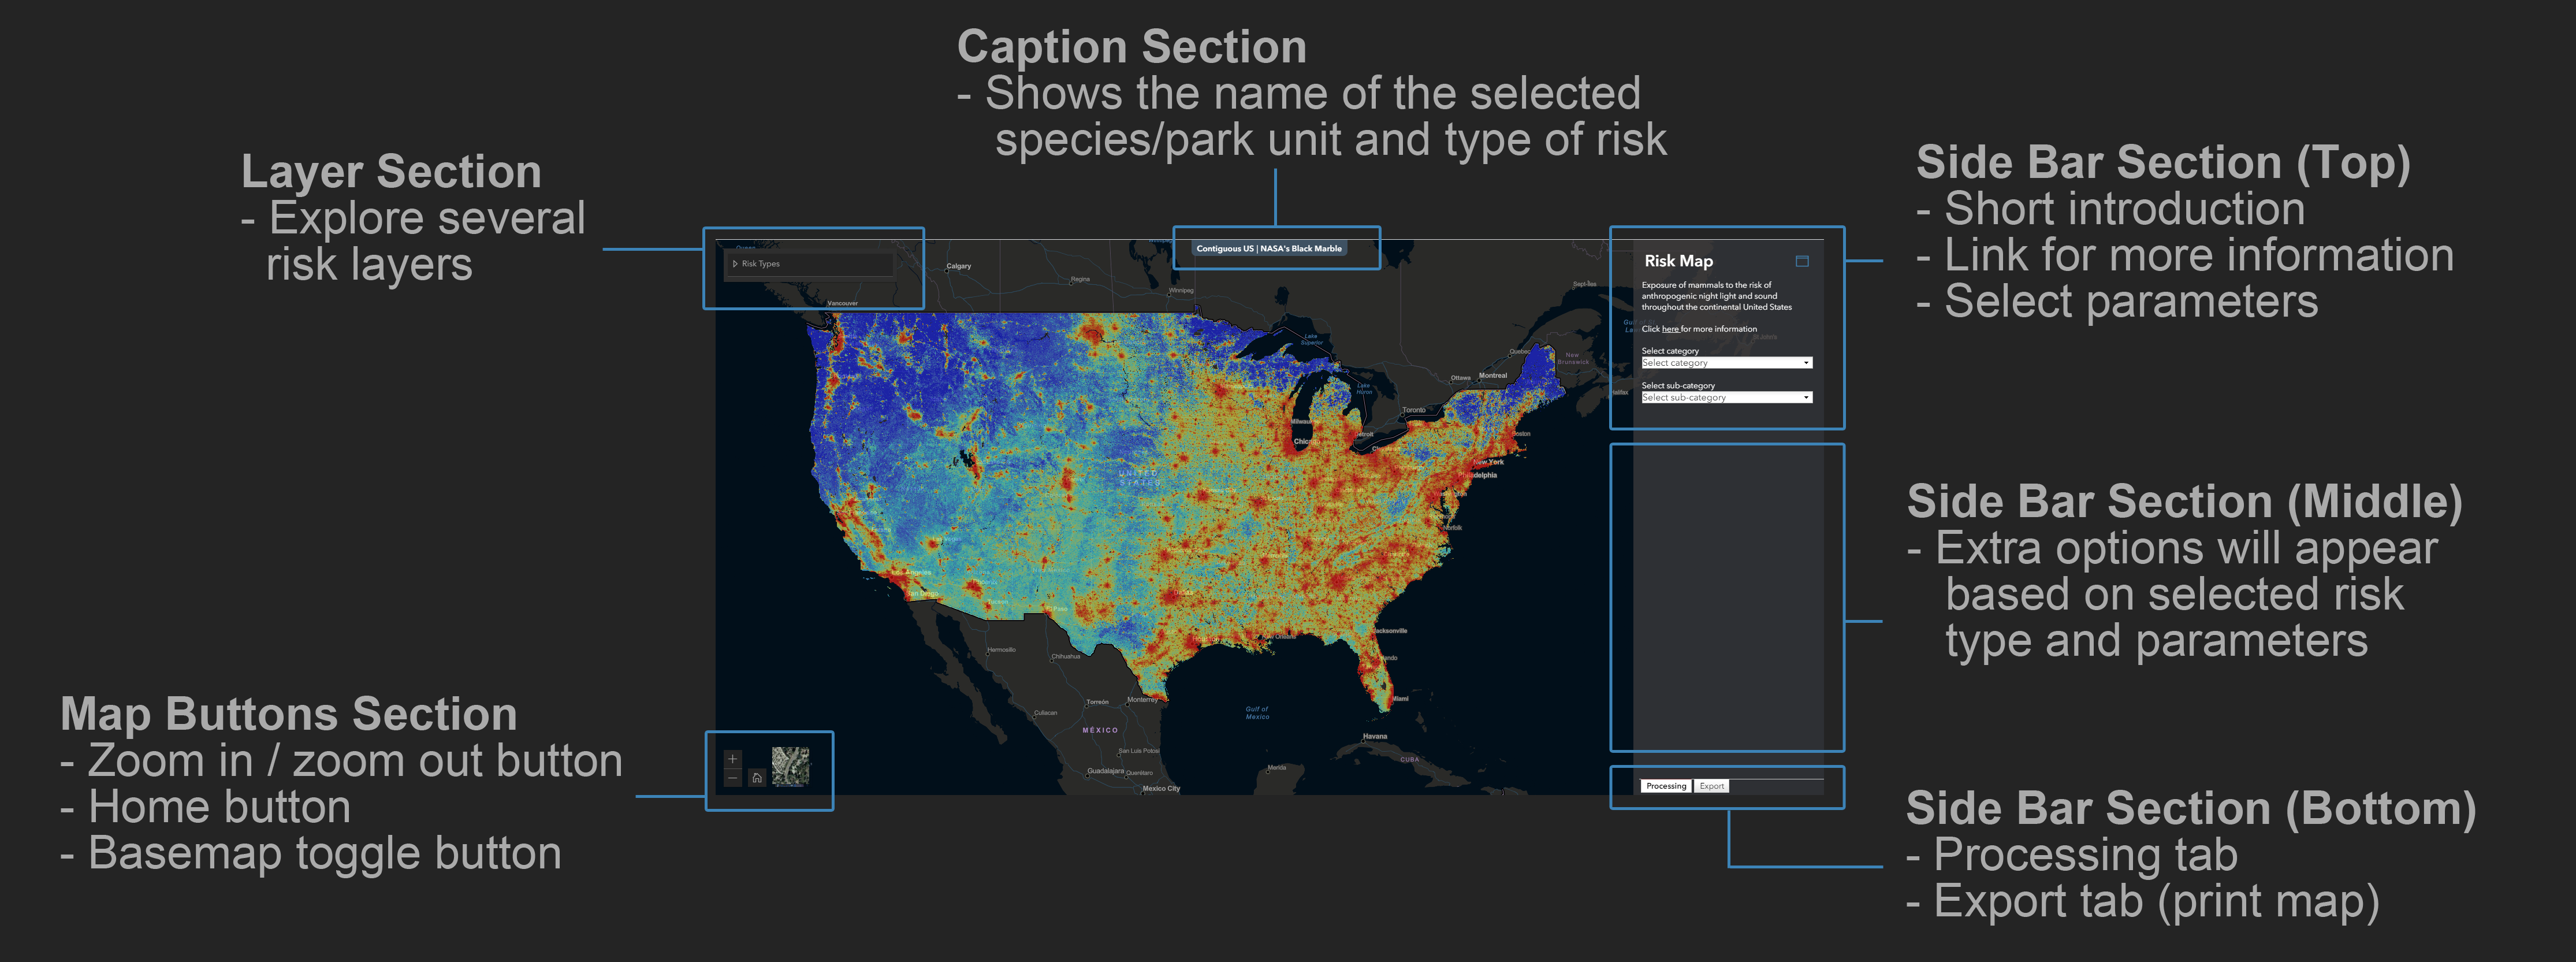
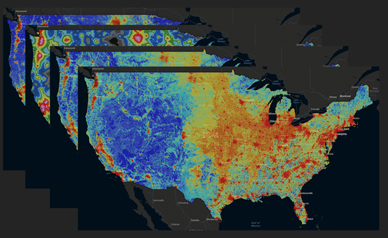
Available Risk Layers
4 types of risk layers to explore:
- Anthropogenic Night Light Source
- Sky Light Pollution Ratio (Skyglow)
- Transient Noise Exceedance
- Chronic Noise Exceedance
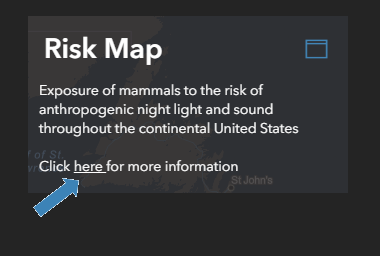
For more information, visit the "more info" page.
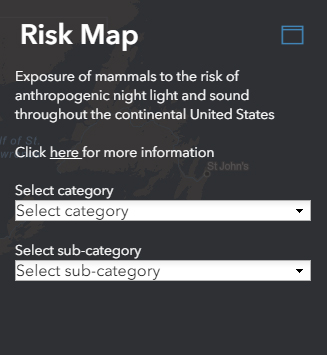
Selecting Parameters
Step 1: Select category
Step 2: Select from the dropdown or search by mammal species or by national park unit
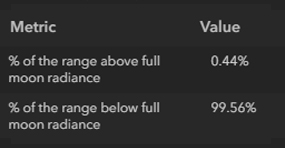
Different Types of Results

Metrics such as percent above/below threshold values for individual risk type are available for mammal species range and park unit boundary. Associated maps are also available.
Different Types of Results

Available only when 'Anthropogenic Night Light Source' layer is the selected risk type.
A chart showing the changes in radiance values for the selected mammal species or park unit will appear.

Available only when selected category is "National Park Units."
A list of species which distribution ranges overlap with the selected park unit will appear. Species list is currently available for National Parks.
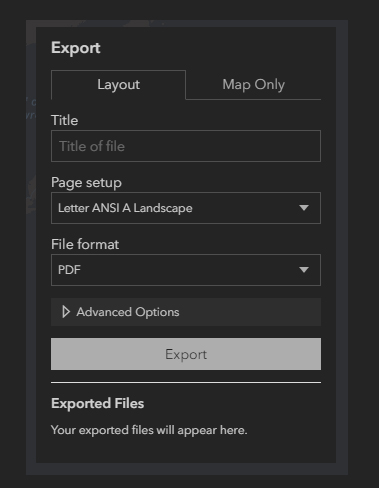
Export Map
Available in the Side Bar Export Tab
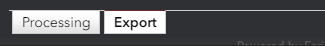
Allow exporting of maps in various file formats.
Get Ready to Explore
Try this web map application!
Additional information available in
'More Info' page