Anthropogenic night light and noise are increasingly changing landscapes and ecosystems across the United States
with implications for wildlife and biodiversity. Identifying which species or national park units are most at risk from anthropogenic night light and noise
(ANLN) is necessary to direct conservation and mitigation efforts.
To better understand the impacts of ANLN on the spatial distribution of vertebrate species within the contiguous United States, we use
a combination of remotely sensed data and spatial modeling.
Suggested citation: Carter N, Sanciangco JC, Ditmer M. 2020. Mapping Anthropogic Night Light and Noise. Web map application.
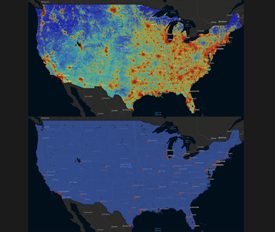
1. Anthropogenic Night Light Source. This layer is derived from NASA's
Visible Infrared Imaging Radiometer Suite (VIIRS) Day/Night band data. These data exclude the influence of moon light, clouds, terrain, wildfire, seasons, atmospheric effects, snow,
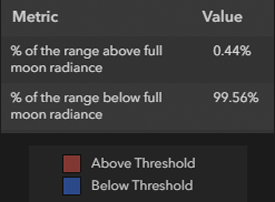
and stray light (Román et al. 2018). Values exceeding full moonlight are considered very high
sources of anthropogenic nightlight, and are used here as our threshold (Román et al. 2018).
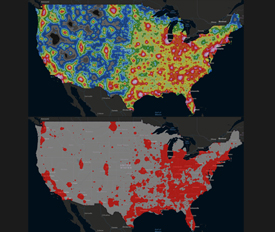
2. Sky Light Pollution Ratio. This is based on a model of skyglow derived from NASA's
Visible Infrared Imaging Radiometer Suite (VIIRS) Day/Night band data. It estimates the horizontal and vertical illuminance from skyglow. The value of "2" was used as our threshold in the map,
because values above that are considered high skyglow and a potential threat to sensitive protected areas (Duriscoe et al. 2018).
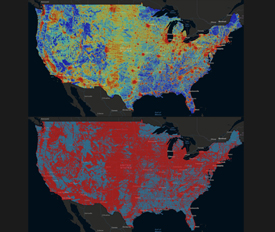
3. Transient Noise Exceedance. This is based on a spatial model of decibel (dB) levels derived from acoustic recordings gathered by National Park Service
across the country. This layer represents anthropogenic sound levels exceeded only 10% of the time. A value of 3 dB corresponds to a 50% reduction in the spatial extent of the "listening area" for most vertebrates
(Buxton et al. 2020). We used this value as the threshold in our maps.
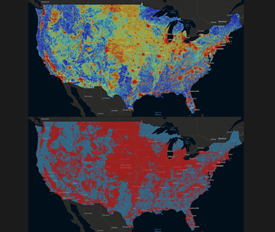
4. Chronic Noise Exceedance. This is based on a spatial model of decibel (dB) levels derived from acoustic recordings gathered by National Park Service
across the country. This layer represents anthropogenic sound levels exceeded only 90% of the time. A value of 3 dB corresponds to a 50% reduction in the spatial extent of the "listening area" for most vertebrates
(Buxton et al. 2020). We usde this value as the threshold in our maps.

On intitial load, risk layers for the contiguous US are visible. This will allow users to visualize overall pattern of risk.

Generalized distribution range of mammals that are found in the US. The range data are from the IUCN.
Visualize the risk within the boundaries of parks managed by the National Park Service.
Available layers for the contiguous US, mammal species, and national park units allow for seamless navigation.
Metrics including percentage of range below and above thresholds and the associated maps are available for all mammals, park units, and types of risk.
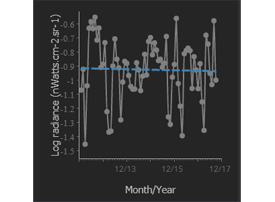
Chart showing changes in log radiance values from January 2012 to September 2017 is available only for "Anthropogenic Night Light Source" risk layer. A trend (regression)
line calculated using the least squares method is also shown.
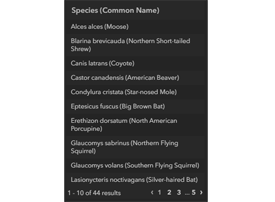
Species list is available only if "National Park Unit" parameter is selected. These are the species whose distribution ranges intersect with the park unit boundary.
Dr. Jesse Barber
Boise State University
Dr. Clint Francis
California Polytechnic State University
Dr. David Stoner
Utah State University
Dr. Andrew Molthan
NASA Marshall Space Flight Center
Dr. Kurt Fristrup
National Park Service
Natural Sounds and Night Skies Division
Suomi NPP Mission |
Suomii NPP- Visible Infrared Imaging Radiometer Suite (VIIRS) |
International Dark Sky Association |
The Consortium for Dark Sky Studies |
NPS Geospatial Sound Modeling Data |
Earth Observation Group, NOAA |
National Geophysical Data Center (VIIRS Data Download)
References
Buxton, R.T., Seymoure, B.M, White, J., Angeloni L.M., Crooks, K.R., Fristrup, K., McKenna, M.F. and Wittemyer, G. JW, Megan KR,
Wittemyer FM. 2020. The relationship between anthropogenic light
and noise in US national parks. Landscape Ecology 35: 1371-1384
Duriscoe, D.M., Anderson, S.J., Luginbuhl, C.B. and Baugh, K.E. 2018.
A simplified model of all-sky artificial sky glow derived from VIIRS Day/Night band data. Journal of Quantitative Spectroscopy and Radiative
Transfer. 214: 133-145.
Román, M.O., Wang, Z., Sun, Q., Kalb, V., Miller, S.D., Molthan, A., Schultz, L., Bell, J., Stokes, E.C., Pandey, B. and Seto,
K.C. 2018. NASA's Black Marble nighttime lights
product suite.Remote Sensing of Environment 210: 113-143.